往期回顾:
简介:不知不觉中,《R语言实战》的学习已经结束,本次赠书活动也结束了。 迫不及待想知道获奖者名单吗? 获奖者将在本文末尾公布。 现在我们先来一起学习一种广泛应用于生物和行为科学、市场和医学研究中的方法,一种对人群或观察结果进行分类的方法——聚类分析。
后台回复“R语言实践”即可获取二维码加入R语言实践学习讨论群。
聚类分析是一种数据缩减技术,旨在揭示数据集中的观察子集。 它可以将大量的观察结果分成几个类别。
类是由多个观察值组成的组。 组内观察的相似度高于组间的相似度。
两种最常用的聚类方法是层次凝聚聚类和分区聚类。
尽管聚类方法各不相同,但它们通常遵循相似的步骤。
16.1 聚类分析的一般步骤
有效的聚类分析是一个多步骤的过程,其中每个决策都可能影响聚类结果的质量和有效性。
1.选择正确的变量——最重要的
选择对于识别和理解数据中不同观察分组可能很重要的变量。
2. 缩放数据
如果分析中选择的变量变化很大,则该变量对结果的影响最大。 因此,在分析之前通常需要对数据进行缩放。
最常见的方法是将每个变量标准化,使其均值为 0,标准差为 1。
其他替代方案包括将每个变量除以其最大值或从其平均值中减去该变量并除以该变量的平均绝对偏差。
这可以用下面的代码来解释:
df1 <- apply(mydata, 2, function(x){(x-mean(x))/sd(x)})df2 <- apply(mydata, 2, function(x){x/max(x)})df3 <- apply(mydata, 2, function(x){(x – mean(x))/mad(x)})
PS:您可以使用scale()函数将变量标准化为平均值为0和标准差为1,这相当于第一个代码片段(df1)。
3. 寻找异常值
许多聚类方法对异常值非常敏感,这可能会扭曲所得的聚类解决方案。
可以通过异常值包中的函数过滤(和删除)不寻常的单变量异常值。
mvoutlier 包包含可以识别多元变量中的异常值的函数。
4. 计算距离
尽管不同的聚类算法差异很大,但它们通常需要计算被聚类实体之间的距离。 两个观测值之间最常用的距离度量是欧几里德距离,其他选项包括曼哈顿距离、兰金距离、非对称二元距离、最大距离和明可夫斯基距离。
5. 选择聚类算法
层次聚类适用于小样本(例如 150 个观测值或更少),而嵌套聚类在这种情况下更实用。
聚类可以处理更大量的数据,但聚类的数量需要提前确定。
一旦选择了分层或分区方法,就必须选择特定的聚类算法。
6. 获取一种或多种聚类方法
可以使用步骤(5)中选择的方法。
7. 确定班级数量
常见的方法是尝试不同数量的类(例如 2~K)并比较解决方案的质量。 NbClust 包中的 NbClust() 函数提供了 30 种不同的指标来帮助选择。
8. 得到最终的聚类解
一旦确定了类的数量,就可以提取子组以形成最终的聚类方案。
9. 可视化结果
可视化可以确定聚类方案的重要性和有用性。
层次聚类的结果通常表示为树状图。
划分结果通常用视觉双变量聚类图表示。
10、口译类
一旦确定了聚类方案,就必须对聚类进行解释(或许还可以命名)。 这通常是通过获取类中每个变量的汇总统计数据来完成的。
对于连续数据,计算每个类别中变量的平均值和中位数。
对于混合数据(包含分类变量的数据),每个类别的众数或类别分布将在结果中返回。
11. 验证结果
如果使用不同的聚类方法或不同的样本,是否会产生相同的聚类?
fpc、clv 和 clValid 软件包包含用于评估集群解决方案稳定性的函数。
16.2 计算距离
聚类分析的第一步是测量样本单元之间的距离、相异性或相似性。
两个观测值之间的欧几里得距离定义为:
i 和 j 代表第 i 个和第 j 个观测值
p 是变量的数量。
示例:flexclust 包中的营养数据集,包括 27 种肉类、鱼类和家禽的营养测量值
鉴于前 4 个观察结果:
data(nutrient, package="flexclust")head(nutrient, 4)energy protein fat calcium ironBEEF BRAISED 340 20 28 9 2.6HAMBURGER 245 21 17 9 2.7BEEF ROAST 420 15 39 7 2.0BEEF STEAK 375 19 32 9 2.6
前两个观测值(炖牛肉和汉堡)之间的欧几里德距离为:
d = √(340-245)^2 + (20-21)^2 + (28-17)^2 + (9-9)^2 + (26-27)^2 = 95.64
dist() 函数可用于计算矩阵或数据框中所有行(观测值)之间的距离。 格式为:
dist(x, method=)x 表示输入数据,默认为欧氏距离。
该函数默认返回一个下三角矩阵,但 as.matrix() 函数可以使用标准括号表示法获取距离。
计算前 4 个观测值之间的距离:
d <- dist(nutrient)as.matrix(d)[1:4,1:4]BEEF BRAISED HAMBURGER BEEF ROAST BEEF STEAKBEEF BRAISED 0.00000 95.6400 80.93429 35.24202HAMBURGER 95.64000 0.0000 176.49218 130.87784BEEF ROAST 80.93429 176.4922 0.00000 45.76418BEEF STEAK 35.24202 130.8778 45.76418 0.00000
观察之间的距离越大,异质性就越大。 dist()函数计算的前两个观测值之间的距离与手工计算一致。
需要注意的是,在营养数据集中,距离很大程度上是由变量energy(能量)控制的,因为这个变量在较大的范围内变化。 缩放数据有助于均衡每个变量的影响。
16.3 层次聚类分析
层次聚类算法如下:
将每个观察值(行或单元格)定义为一个类别;
计算每个类别与其他类别之间的距离;
将距离最短的两个类别合并为一类,使类别数减少一类;
重复步骤 (2) 和 (3),直到包含所有观测值的类合并为一个类。
在层次聚类算法中,主要区别在于它们对类的定义不同(步骤(2))。
表16-1 常见的层次聚类方法
聚类法
两个类之间距离的定义
单联动
一类中的点与另一类中的点之间的最小距离
全联动
一类中的点与另一类中的点之间的最大距离
平均联动
一类中的点与另一类中的点之间的平均距离(也称为 UPGMA,未加权对组平均值)
质心
两个类中质心(变量均值向量)之间的距离。对于单个观测值,质心是变量的值
沃德法
两个类之间所有变量的方差分析平方和
层次聚类方法可以使用hclust()函数来实现。 格式为:
hclust(d, method=)其中d是dist()函数生成的距离矩阵,方法包括“single”、“complete”、“average”、“centroid”和“ward”。
根据 27 种食物的营养信息,找出相似点和差异并对其进行分组:
#营养数据的平均联动聚类data(nutrient, package="flexclust") #载入数据row.names(nutrient) <- tolower(row.names(nutrient)) #将行名改为小写nutrient.scaled <- scale(nutrient) #将其标准化为均值为0、方差为1d <- dist(nutrient.scaled) #采用欧几里得距离fit.average <- hclust(d, method="average") #应用平均联动方法plot(fit.average, hang=-1, cex=.8, #hang命令展示观测值的标签(让它们在挂在0下面)main="Average linkage Clustering") #结果用树状图来展示,见图16-1

图16-1 营养数据的平均连锁聚类
树形图应该从下往上阅读,显示项目如何组合成类。
每个观察值最初都属于自己的类别,然后合并两个最接近的类别(红烧牛肉和烟熏火腿)。
烤猪肉和焖猪肉相结合,鸡肉罐头和金枪鱼罐头相结合。
红烧牛肉/烟熏火腿类别与烤猪肉/焖猪肉类别合并(该类别目前包括四种食品)。
合并将持续进行,直到所有观察结果都合并为一类。
身高等级代表身高等级之间的综合决策值。 对于平均链接,标准是一类中的点与其他类中的点之间的距离的平均值。
NbClust 包提供了大量索引来确定聚类分析中的最佳聚类数量。 该结果可以作为选择簇数K的参考。
输入:需要聚类的矩阵或数据框、使用的距离度量和聚类方法以及最小和最大聚类的数量。
返回:对于每个聚类索引,建议聚类的最佳数量。
选择簇数:
library(NbClust)devAskNewPage(ask=TRUE)nc <- NbClust(nutrient.scaled, distance="euclidean",min.nc=2, max.nc=15, method="average")按<Return>键来看下一个图: #见图16-2*** : The Hubert index is a graphical method of determining the number of clusters.In the plot of Hubert index, we seek a significant knee that corresponds to asignificant increase of the value of the measure i.e the significant peak in Hubertindex second differences plot.按<Return>键来看下一个图: #见图16-3*** : The D index is a graphical method of determining the number of clusters.In the plot of D index, we seek a significant knee (the significant peak in Dindexsecond differences plot) that corresponds to a significant increase of the value ofthe measure.******************************************************************** Among all indices:* 4 proposed 2 as the best number of clusters* 4 proposed 3 as the best number of clusters* 2 proposed 4 as the best number of clusters* 4 proposed 5 as the best number of clusters* 1 proposed 9 as the best number of clusters* 1 proposed 10 as the best number of clusters* 2 proposed 13 as the best number of clusters* 1 proposed 14 as the best number of clusters* 4 proposed 15 as the best number of clusters ***** Conclusion ***** * According to the majority rule, the best number of clusters is 2table(nc$Best.n[1,])0 1 2 3 4 5 9 10 13 14 152 1 4 4 2 4 1 1 2 1 4barplot(table(nc$Best.n[1,]),xlab="Numer of Clusters", ylab="Number of Criteria",main="Number of Clusters Chosen by 26 Criteria")按<Return>键来看下一个图: #见图16-4
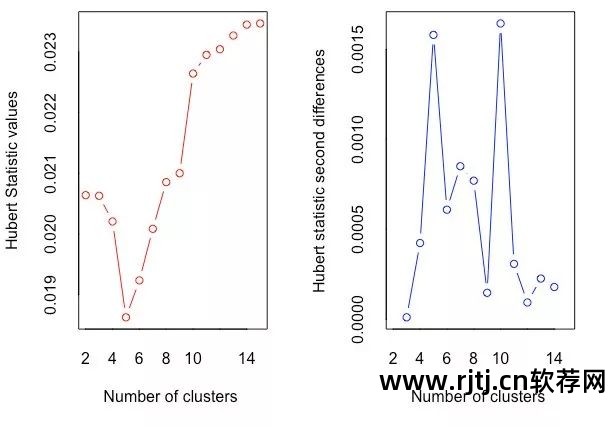
图16-2 使用Hubert指数确定簇数的图解方法
在休伯特指数图中,寻找与测量值显着增加相对应的显着拐点,即休伯特指数二阶差分图中的显着峰值。
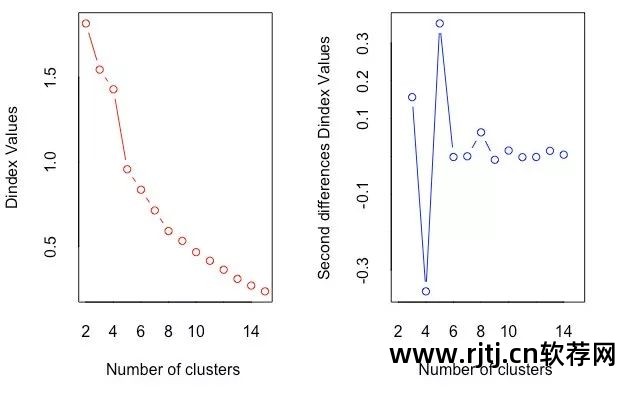
图16-3 使用D索引确定簇数的图解方法
在 D 指数图中,查找与测量值显着增加相对应的显着拐点(D 指数第二个差异图中的显着峰值)。
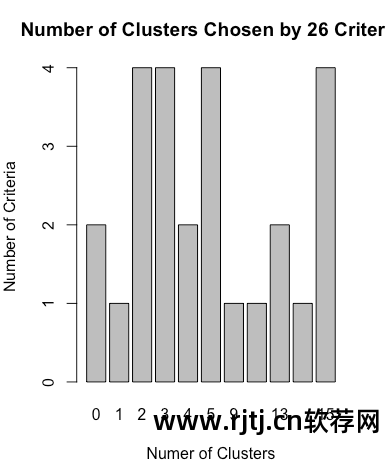
图16-4 使用Nbclust包提供的26个标准得到的推荐簇数量
四个判断标准一致认为簇数为2,四个判断标准一致认为簇数为3,以此类推。
您可以尝试使用“投票数”最高的簇数(2、3、5 和 15),并选择其中最有意义的解释之一。
得到最终的聚类方案(五类聚类方案):
clusters <- cutree(fit.average, k=5) #分配情况,把树状图分成五类table(clusters)clusters1 2 3 4 57 16 1 2 1aggregate(nutrient, by=list(cluster=clusters), median) #描述聚类,获取每类的中位数,结果以原始度量形式输出cluster energy protein fat calcium iron1 1 340.0 19 29 9 2.502 2 170.0 20 8 13 1.453 3 160.0 26 5 14 5.904 4 57.5 9 1 78 5.705 5 180.0 22 9 367 2.50aggregate(as.data.frame(nutrient.scaled), #描述聚类,获取每类的中位数,结果以标准度量形式输出by=list(cluster=clusters), median)cluster energy protein fat calcium iron1 1 1.3101024 0.0000000 1.3785620 -0.4480464 0.081104562 2 -0.3696099 0.2352002 -0.4869384 -0.3967868 -0.637431143 3 -0.4684165 1.6464016 -0.7534384 -0.3839719 2.407791574 4 -1.4811842 -2.3520023 -1.1087718 0.4361807 2.270927635 5 -0.2708033 0.7056007 -0.3981050 4.1396825 0.08110456plot(fit.average, hang=-1, cex=.8, #结果绘图main="Average linkage Clustering\n5 Cluster Solution")rect.hclust(fit.average, k=5) #叠加五类的解决方案,见图16-5
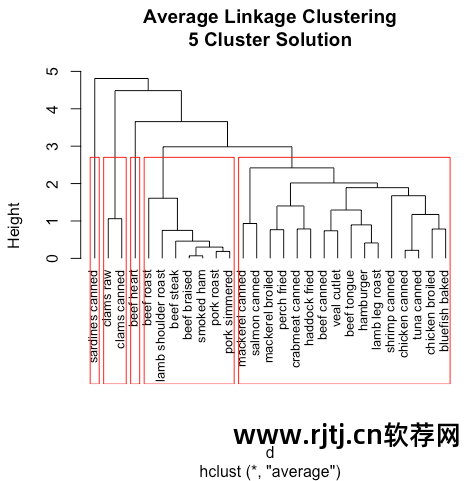
图 16-5 使用五类解决方案的营养数据的平均连锁聚类
在分层算法中,一旦将观察值分配给一个类,就无法在以后的过程中重新分配它。 此外,层次聚类很难应用于具有数百甚至数千个观测值的大样本。
16.4 划分和聚类分析
在划分方法中,观测值被分为 K 组,并根据给定规则将其洗牌到最粘性的类别中。
常用的算法包括 K 均值和基于中心点的划分 (PAM)。
1.K均值聚类
最常见的划分方法是 K 均值聚类分析。
从概念上讲,K-means 算法如下:
选择K个中心点(随机选择K行);
将每个数据点分配到其最近的中心点;
重新计算每个类别中的点到类别中心点的平均距离(即获得长度为p的均值向量,其中p为变量数量);
将每个数据分配到其最近的中心点;
重复步骤(3)和(4),直到不再分配所有观测值或达到最大迭代次数(R 使用 10 作为默认迭代次数)。
R中K-means的函数格式为:
kmeans(x, centers)x 表示数值数据集(矩阵或数据框)
中心是要提取的簇的数量
该函数返回:类成员、类中心、平方和(类内平方和、类间平方和、总平方和)和类大小。
wssplot <- function(data, nc=15, seed=1234){wss <- (nrow(data)-1)*sum(apply(data,2,var))for (i in 2:nc){set.seed(seed)wss[i] <- sum(kmeans(data, centers=i)$withinss)}plot(1:nc, wss, type="b", xlab="Number of Clusters",ylab="Within groups sum of squares")}
data参数是用于分析的数值数据,nc是要考虑的最大簇数,seed是随机数种子。
示例:包含 178 种意大利葡萄酒中 13 种化学成分的数据集
观察结果代表三个葡萄酒品种,由第一个变量(类型)表示。 您可以删除此变量并执行聚类分析以查看是否可以恢复已知的结构。
葡萄酒数据的 K 均值聚类:
data(wine, package="rattle")head(wine)Type Alcohol Malic Ash Alcalinity Magnesium Phenols Flavanoids1 1 14.23 1.71 2.43 15.6 127 2.80 3.062 1 13.20 1.78 2.14 11.2 100 2.65 2.763 1 13.16 2.36 2.67 18.6 101 2.80 3.244 1 14.37 1.95 2.50 16.8 113 3.85 3.495 1 13.24 2.59 2.87 21.0 118 2.80 2.696 1 14.20 1.76 2.45 15.2 112 3.27 3.39df <- scale(wine[-1]) #标准化数据Nonflavanoids Proanthocyanins Color Hue Dilution Proline1 0.28 2.29 5.64 1.04 3.92 10652 0.26 1.28 4.38 1.05 3.40 10503 0.30 2.81 5.68 1.03 3.17 11854 0.24 2.18 7.80 0.86 3.45 14805 0.39 1.82 4.32 1.04 2.93 7356 0.34 1.97 6.75 1.05 2.85 1450wssplot(df) #使用wssplot()决定聚类的个数按<Return>键来看下一个图: #见图16-6library(NbClust) #使用Nbclust()决定聚类的个数set.seed(1234)devAskNewPage(ask=TRUE)nc <- NbClust(df, min.nc=2, max.nc=15, method="kmeans")按<Return>键来看下一个图: #见图16-7*** : The Hubert index is a graphical method of determining the number of clusters.In the plot of Hubert index, we seek a significant knee that corresponds to asignificant increase of the value of the measure i.e the significant peak in Hubertindex second differences plot.按<Return>键来看下一个图: #见图16-8*** : The D index is a graphical method of determining the number of clusters.In the plot of D index, we seek a significant knee (the significant peak in Dindexsecond differences plot) that corresponds to a significant increase of the value ofthe measure.******************************************************************** Among all indices:* 2 proposed 2 as the best number of clusters* 19 proposed 3 as the best number of clusters* 1 proposed 14 as the best number of clusters* 1 proposed 15 as the best number of clusters***** Conclusion ****** According to the majority rule, the best number of clusters is 3table(nc$Best.n[1,])0 1 2 3 14 152 1 2 19 1 1barplot(table(nc$Best.n[1,]),xlab="Number of Clusters", ylab="Number of Criteria",main="Number of Clusters Chosen by 26 Criteria")按<Return>键来看下一个图: #见图16-9

图16-6 绘制了组内平方和与提取的簇数量之间的比较
从类别一到类别三下降得非常快(然后下降得非常慢),因此建议使用簇数为三的解决方案。
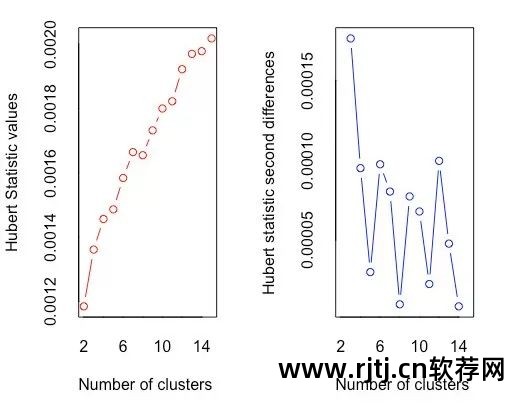
图16-7 Hubert指数决定簇的数量
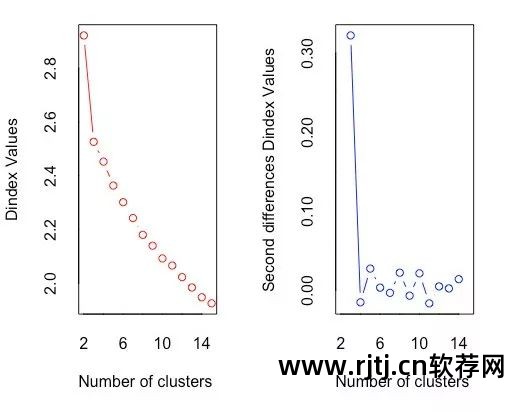
图16-8 D索引决定簇的数量
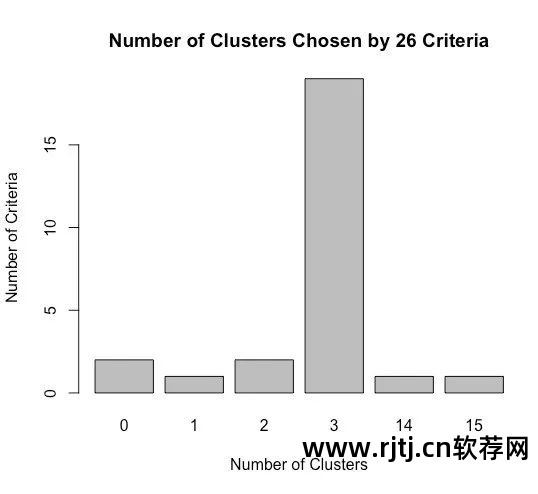
图16-9 NbClust包中26个指标推荐的集群数
使用 kmeans() 函数获取最终的聚类:
set.seed(1234)fit.km <- kmeans(df, 3, nstart=25) #进行K均值聚类分析fit.km$size[1] 62 65 51fit.km$centersAlcohol Malic Ash Alcalinity Magnesium1 0.8328826 -0.3029551 0.3636801 -0.6084749 0.575962082 -0.9234669 -0.3929331 -0.4931257 0.1701220 -0.490328693 0.1644436 0.8690954 0.1863726 0.5228924 -0.07526047Phenols Flavanoids Nonflavanoids Proanthocyanins1 0.88274724 0.97506900 -0.56050853 0.578654272 -0.07576891 0.02075402 -0.03343924 0.058101613 -0.97657548 -1.21182921 0.72402116 -0.77751312Color Hue Dilution Proline1 0.1705823 0.4726504 0.7770551 1.12202022 -0.8993770 0.4605046 0.2700025 -0.75172573 0.9388902 -1.1615122 -1.2887761 -0.4059428aggregate(wine[-1], by=list(cluster=fit.km$cluster), mean) #得到原始矩阵中每一类的变量均值cluster Alcohol Malic Ash Alcalinity Magnesium1 1 13.67677 1.997903 2.466290 17.46290 107.967742 2 12.25092 1.897385 2.231231 20.06308 92.738463 3 13.13412 3.307255 2.417647 21.24118 98.66667Phenols Flavanoids Nonflavanoids Proanthocyanins Color1 2.847581 3.0032258 0.2920968 1.922097 5.4535482 2.247692 2.0500000 0.3576923 1.624154 2.9730773 1.683922 0.8188235 0.4519608 1.145882 7.234706Hue Dilution Proline1 1.0654839 3.163387 1100.22582 1.0627077 2.803385 510.16923 0.6919608 1.696667 619.0588
跨列表类型(酒品种)和类成员由以下代码表示:
ct.km <- table(wine$Type, fit.km$cluster)ct.km1 2 31 59 0 02 3 65 33 0 0 48
类型变量和类之间的一致性可以使用 flexclust 包中的 Rand 索引来量化:
library(flexclust)randIndex(ct.km)ARI0.897495
调整后的 RAND 指数提供了两个分区之间一致性的衡量标准,即调整机会的衡量标准。 它的范围从 –1(不同意)到 1(强烈同意)。 葡萄酒品种类型和等级解决方案之间的一致性为 0.9。
2. 围绕中心点(PAM)划分
由于K-means聚类方法是基于均值的,因此对异常值很敏感。 更稳健的方法是围绕中心点 (PAM) 进行分区。
与其使用质心(变量均值向量)来表示类别,不如使用最具代表性的观测值(称为中心点)。
K-means聚类一般使用欧氏距离,而PAM可以使用任何距离计算。 因此,PAM可以容纳混合数据类型,并且不限于连续变量。
PAM算法如下:
随机选择K个观测值(每个观测值称为中心点);
计算观测值到各个中心的距离/相异度;
将每个观测值分配给最近的中心点;
计算每个中心点到每个观测值的距离总和(总成本);
在该类别中选择一个不是中心的点,并将其与中心点交换;
将每个点重新分配到其最近的中心点;
再次计算总成本;
若总成本小于步骤(4)计算的总成本,则以新点为中心点;
重复步骤(5)~(8),直至中心点不再变化。
您可以使用 cluster 包中的 pam() 函数来使用基于中心点的划分方法。
格式为:
pam(x, k, metric="euclidean", stand=FALSE)x 表示数据矩阵或数据框,
k代表簇的数量,
metric 表示所使用的相似性/不相似性的度量,
Stand是一个逻辑值,指示在计算该指标之前是否应该对任何变量进行标准化。
对 wine 数据使用基于质心的分区:
library(cluster)set.seed(1234)fit.pam <- pam(wine[-1], k=3, stand=TRUE) #聚类数据的的标准化fit.pam$medoids #输出中心点Alcohol Malic Ash Alcalinity Magnesium Phenols[1,] 13.48 1.81 2.41 20.5 100 2.70[2,] 12.25 1.73 2.12 19.0 80 1.65[3,] 13.40 3.91 2.48 23.0 102 1.80Flavanoids Nonflavanoids Proanthocyanins Color Hue[1,] 2.98 0.26 1.86 5.1 1.04[2,] 2.03 0.37 1.63 3.4 1.00[3,] 0.75 0.43 1.41 7.3 0.70Dilution Proline[1,] 3.47 920[2,] 3.17 510[3,] 1.56 750clusplot(fit.pam, main="Bivariate Cluster Plot")#画出聚类的方案,见图16-10
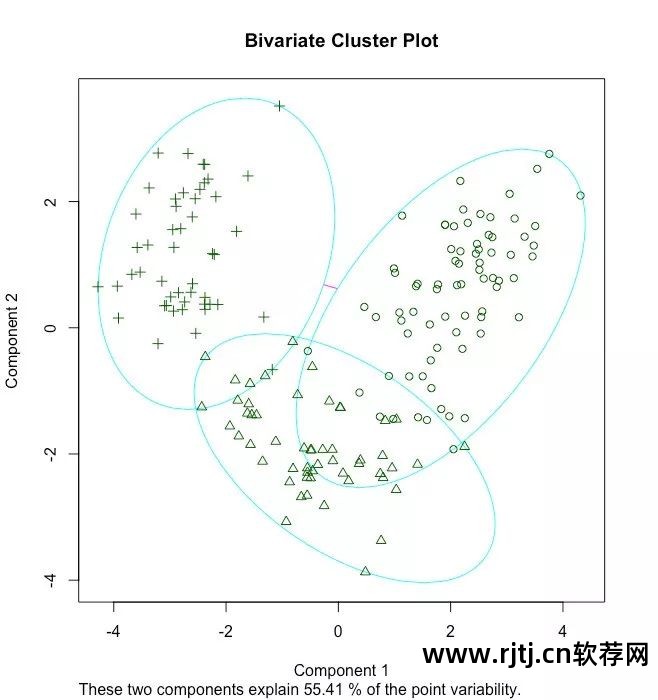
图16-10 基于意大利葡萄酒数据使用PAM算法得到的三组聚类图
请注意,此处获得的中心点是葡萄酒数据集中的实际观测值。
在本例中,分别选择了 36、107 和 175 个观测值来代表这三个类别。 通过绘制从 13 个测量变量获得的前两个主成分的每个观测值的坐标来创建双变量图。 每个类都由一个椭圆表示,该椭圆具有包含其所有点的最小面积。
另请注意,在以下示例中,PAM 的性能不如 K-means:
ct.pam <- table(wine$Type, fit.pam$clustering)ct.pam1 2 31 59 0 02 16 53 23 0 1 47randIndex(ct.pam)ARI0.6994957
调整后的 RAND 指数从 0.9(K 均值)下降至 0.7。
16.5 避免不存在的类
聚类分析是一种旨在识别数据集子组的方法,它甚至可以发现不存在的类。
library(fMultivar)set.seed(1234)df <- rnorm2d(1000, rho=.5) #从相关系数为0.5的二元正态分布中抽取1000个观测值df <- as.data.frame(df)plot(df, main="Bivariate Normal Distribution with rho=0.5")

图16-11 二值正态数据(样本量n=1000),该数据集中没有类别
使用 wssplot() 和 Nbclust() 函数确定当前的簇数:
wssplot(df) #使用wssplot()函数确定聚类个数,见图16-12library(NbClust)nc <- NbClust(df, min.nc=2, max.nc=15, method="kmeans")按键来看下一个图: #见图16-13 *** : The Hubert index is a graphical method of determining the number of clusters.In the plot of Hubert index, we seek a significant knee that corresponds to asignificant increase of the value of the measure i.e the significant peak in Hubertindex second differences plot.按键来看下一个图: #见图16-14 *** : The D index is a graphical method of determining the number of clusters.In the plot of D index, we seek a significant knee (the significant peak in Dindexsecond differences plot) that corresponds to a significant increase of the value ofthe measure.******************************************************************** Among all indices:* 8 proposed 2 as the best number of clusters* 4 proposed 3 as the best number of clusters* 1 proposed 4 as the best number of clusters* 1 proposed 5 as the best number of clusters* 4 proposed 9 as the best number of clusters* 1 proposed 10 as the best number of clusters* 1 proposed 13 as the best number of clusters* 3 proposed 15 as the best number of clusters***** Conclusion ****** According to the majority rule, the best number of clusters is 2barplot(table(nc$Best.n[1,]),xlab="Number of Clusters", ylab="Number of Criteria",main="Number of Clusters Chosen by 26 Criteria") #见图16-15
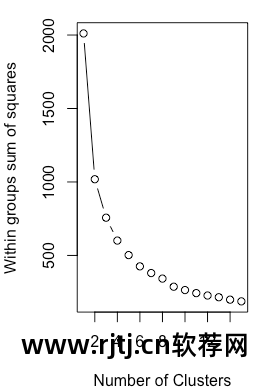
图片 16-12 二值数据的组内平方和与 K-means 簇数的比较
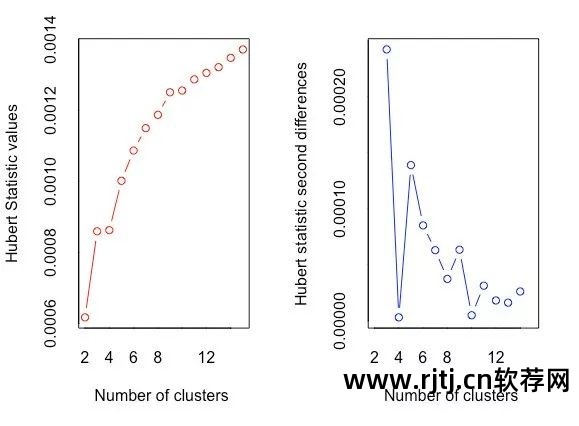
图16-13 Hubert指数决定簇的数量
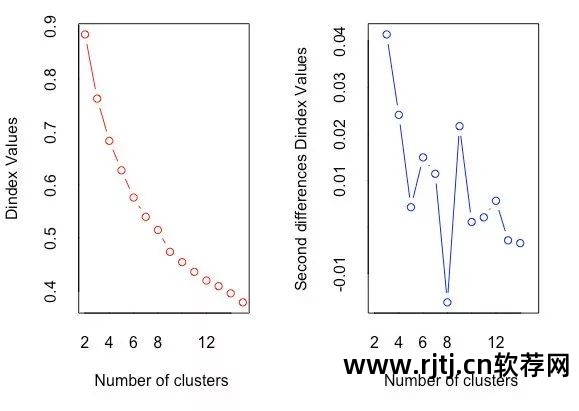
图16-14 D索引决定簇的数量
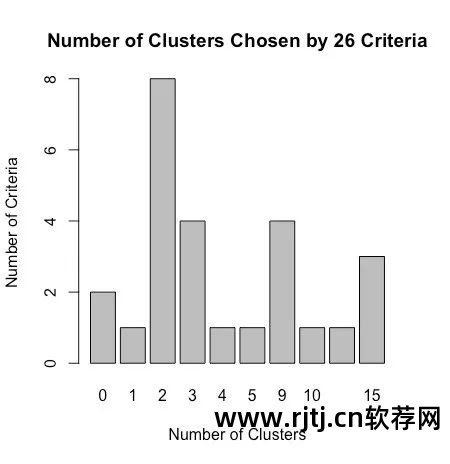
图16-15 使用Nbclust包中的判别标准推荐的二进制数据的聚类数据。 建议的班级数为 2 或 3。
wssplot() 函数建议簇数为 3,而 NbClust 函数返回的标准大多支持 2 或 3 个类别。
使用PAM方法进行双聚类分析:
library(ggplot2)library(cluster)fit <- pam(df, k=2)df$clustering <- factor(fit$clustering)ggplot(data=df, aes(x=V1, y=V2, color=clustering, shape=clustering)) +geom_point() + ggtitle("Clustering of Bivariate Normal Data")
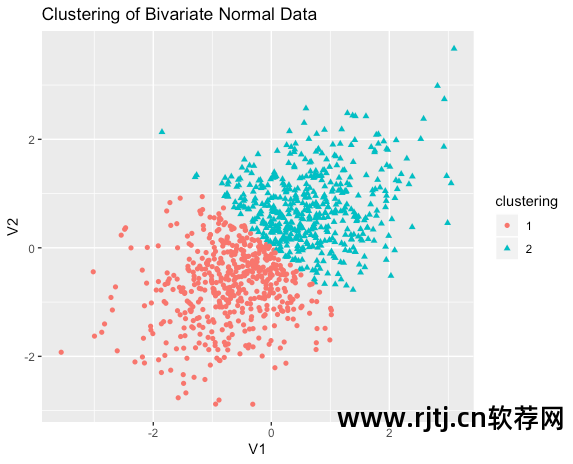
图16-16 对二进制数据进行PAM聚类分析,提取两个类别。注意,类别内的数据是任意划分的
显然,这种划分是人为的。 这里实际上没有真正的课程。
NbClust 包中的立方簇准则 (CCC) 通常可以帮助我们揭示不存在的结构。
plot(nc$All.index[,4], type="o", ylab="CCC",xlab="Number of clusters", col="blue")
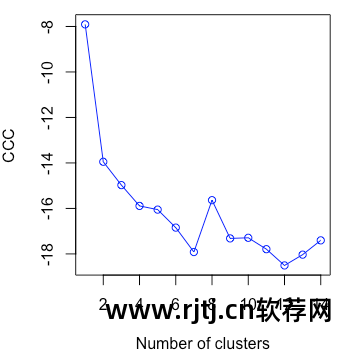
图片 16-17 二进制正态数据的 CCC 图,正确显示不存在类
当 CCC 值为负值并且在两个或多个类别中减小时,它是典型的单峰分布。
聚类分析发现错误聚类的能力使得聚类分析的验证步骤变得非常重要。
如果您试图找到一个在某种意义上“真实”的类(而不是方便的划分),请确保结果是稳健且可重复的。 您可以尝试不同的聚类方法并使用新样本复制结果。 如果相同类型的恢复持续进行r软件在聚类分析,您可以对获得的结果更加有信心。
16.6 总结
在本章中,我们学习了常见聚类分析的一般步骤,描述了层次聚类和划分聚类的常见方法,并验证了不存在的类。 至此,我们的16章《R语言实战》专题系列学习分享就结束了。 不知道大家对R语言及其数据处理和绘图功能是否有了基本的了解呢? 关于R语言还有更多的高级方法和技巧可以通过阅读原著来学习。 本公众号还将持续推出各种实用的R包供学习和分享。 欢迎大家继续关注r软件在聚类分析,一起学习,一起进步~
后台回复“R语言实践”即可获取二维码加入R语言实践学习讨论群。

